scichart
| Install | |
|---|---|
npm install scichart |
|
| Latest Version: | 6.0.14 |
| License: | https://www.scichart.com/scichart-eula |
| Last Updated: | Oct 22, 2026 |
| Links: | GitHub · npm |
SciChart.js: High Performance JavaScript Chart Library
SciChart.JS v6
Find out what's new in every Major and Minor release at the Change Log here
Documentation
Find out our Documentation web-site here
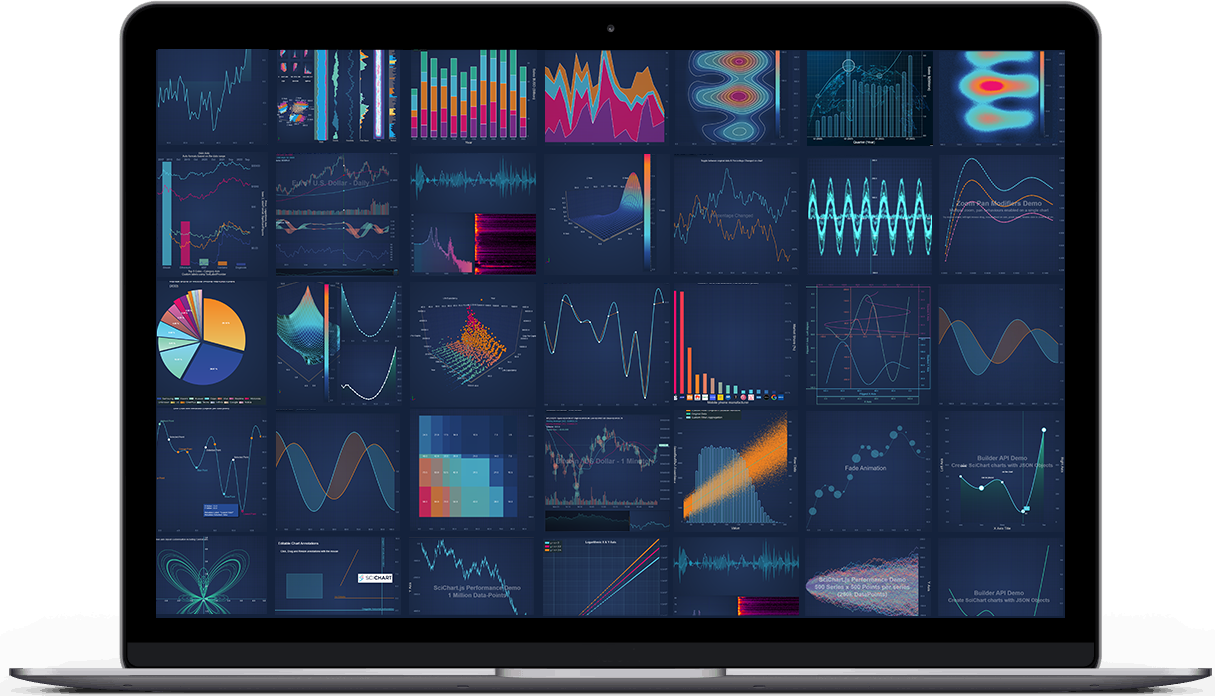
SciChart.js is a High Performance JavaScript Chart library. Leveraging WebGL, WebGPU and WebAssembly to achieve incredible big-data and real-time performance. Fast and able to draw millions of datapoints in realtime, our charts will never cause your app to slow down again!
Why SciChart?
- Learn why we propose SciChart as the Best JavaScript Chart Library in 2024 for Big-Data, complex enterprise apps.
- Read performance test results showing SciChart beating Chart.js, HighCharts, Plotly by a wide margin in a JavaScript Chart Performance Comparison
- Learn the features and key differences of SciChart.js JS Charts library.
- Browse the demos of JavaScript Charts and JavaScript 3D Charts in our interactive React showcase.
SciChart has an extremely configurable and extensible API and is perfect for scientific, financial, medical, engineering and enterprise applications, apps with demanding performance requirements or complex and mission critical charting.
Releases
SciChart.js v6 is the first release supporting WebGPU which sagnificantly improves multichart scenarious like dashboards. Our userbase has demanding requirements from F1 to medical dashboards, IoT telemetry in industrial, aerospace and defense applications, and v6 answers them with:
-
WebGPU rendering — a brand new renderer, selected automatically on Apple Silicon Macs, with WebGL used everywhere else.
-
A tree-shakeable package —
scichartnow ships dual ES-module and CommonJS builds, so bundlers drop the parts of the library you don't use. -
One modular WebAssembly engine — 2D and 3D are now a single wasm module, and the 3D engine is fetched lazily, so 2D-only pages never pay for it.
-
wasm64 (Memory64) binaries — optional builds that lift the 4GB memory ceiling for very large datasets.
-
TableDataSeries— the renamed and extendedXyNDataSeries, now with string-column support. -
Financial Drawing Tools v5.2 Release notes | Breaking Changes
We release often and if you want to report a bug, request a feature or give general feedback contact us!
Upgrading to v6
Read the v5 to v6 Breaking Changes first. Most apps need two changes: the WebAssembly copy step is now a single _wasm directory copy (the separate scichart2d.wasm / scichart3d.wasm files are gone), and a SciChart3DSurface.configure() call should be deleted because SciChartSurface.configure() now configures both engines.
License
SciChart.js is commercial software which ships with a free community edition for personal, non-commercial, educational or blogger/tutorial use.
Licensing Links
- Free Community Licensing FAQs
- Read about our commercial license terms here
- Get Started by following steps here
- Purchase commercial licenses here
- Academic usage, universities and schools qualify for a free non-watermarked license. Read more about this here.
Demo Application
- We've published over 100 JavaScript Chart Demos with ~100 examples you can try in browser.
- You can clone the repo for the demo app at Github: github.com/ABTSoftware/SciChart.JS.Examples
- Or, checkout our boilerplates for various popular Js frameworks:
- Vanilla JS
- React with scichart-react which significantly simplifies wrapping scichart in a react component
- React + Typescript
- React + Vite
- Vue.js
- Angular
- Next.js
- Nuxt
- Svelte + Vite
- Svelte + Rollup
- Electron
Getting Started
We've prepared a short Getting Started guide here.
This will walk you through the entire process of starting in your favourite framework and show you where tutorials and documentation are and examples.
Useful Links
Features & benefits
- Learn about features of SciChart.js here
Onboarding
Support
Purchasing
Quick Start with NPM and Webpack
Tutorial
SciChart.js can be loaded as an ES6 module with Babel or TypeScript transpiler.
- Install SciChart.js
npm install scichart
- Create a simple chart by putting this into
src/index.jsfile
import { SciChartSurface, NumericAxis } from "scichart";

async function initSciChart() {
    const { sciChartSurface, wasmContext } = await SciChartSurface.create("scichart-root");

    // Create an X,Y Axis and add to the chart
    const xAxis = new NumericAxis(wasmContext);
    const yAxis = new NumericAxis(wasmContext);

    sciChartSurface.xAxes.add(xAxis);
    sciChartSurface.yAxes.add(yAxis);
}

initSciChart();
- Create src/index.html file
<html lang="en-us">
    <head>
        <meta charset="utf-8" />
        <meta content="text/html; charset=utf-8" http-equiv="Content-Type" />
        <title>SciChart.js Tutorial 1</title>
        <script async type="text/javascript" src="bundle.js"></script>
    </head>
    <body>
        <h1>Hello SciChart.js world!</h1>
        <p>In this example we setup webpack, scichart and create a simple chart with one X and Y axis</p>

        <!-- the Div where the SciChartSurface will reside -->
        <div id="scichart-root" style="width: 800px; height: 600px;"></div>
    </body>
</html>
- Serve the WebAssembly files. SciChart.js ships its WebAssembly binaries in
node_modules/scichart/_wasm/. Copy that whole directory next to your bundle, e.g. with webpack:
new CopyPlugin({
    patterns: [{ from: "node_modules/scichart/_wasm/", to: "" }]
});
Or skip the copy step entirely and load them from our CDN by calling SciChartSurface.useWasmFromCDN() before you create a chart.
- Run it
npm start. As a result you will see a simple line chart.
Tree-shaking
v6 ships dual ES-module and CommonJS builds, so bundlers that honour the exports and sideEffects fields drop the parts of SciChart.js you never import - including the 3D engine, which is a separate WebAssembly module fetched only when you create a 3D chart.
Your bundler has to see ES-module syntax for this to work. TypeScript projects that emit CommonJS get the non-shakeable build, so set:
{
    "compilerOptions": {
        "module": "esnext",
        "moduleResolution": "bundler"
    }
}
Quick Start with Browser Bundle (Iife bundle)
Tutorial
See the full browser bundle tutorial here
If your environment does not include a bundler like Parcel or Webpack, you can still load SciChart.js using the browser bundle module from jsDelivr
- Include index.min.js in your webpage
<!-- Include specific version into index.html -->
<script src="https://cdn.jsdelivr.net/npm/scichart@6.0.0-alpha.196/index.min.js" crossorigin="anonymous"></script>
- Create scichart-example.js file with a simple chart
// Equivalent of imports when using index.min.js is to declare global variables like this
const { SciChartSurface, NumericAxis, FastLineRenderableSeries, XyDataSeries } = SciChart;

async function initSciChart() {
    // Create the SciChartSurface in the div 'scichart-root'
    const { sciChartSurface, wasmContext } = await SciChartSurface.create("scichart-root");

    // Create an X,Y Axis and add to the chart
    const xAxis = new NumericAxis(wasmContext);
    const yAxis = new NumericAxis(wasmContext);

    sciChartSurface.xAxes.add(xAxis);
    sciChartSurface.yAxes.add(yAxis);

    // Add a series
    sciChartSurface.renderableSeries.add(
        new FastLineRenderableSeries(wasmContext, {
            dataSeries: new XyDataSeries(wasmContext, {
                xValues: [0, 1, 2, 3, 4],
                yValues: [2, 1, 4, 3, 2]
            })
        })
    );
}
Related Packages
Advanced Charting / Charts supporting Javascript / Typescript / React / Angular...
Advanced Charting / Charts supporting Javascript / Typescript / React / Angular...
Advanced Charting / Charts supporting Javascript / Typescript / React / Angular...
Interactive charts and data grids for React, Angular, Vue and the web. Pro visua...
Interactive charts and data grids for React, Angular, Vue and the web. Community...
Version History
| Version | Released | License |
|---|---|---|
| 6.0.14 | https://www.scichart.com/scichart-eula | |
| 6.0.13 | https://www.scichart.com/scichart-eula | |
| 6.0.8 | https://www.scichart.com/scichart-eula | |
| 6.0.6 | https://www.scichart.com/scichart-eula | |
| 6.0.1 | https://www.scichart.com/scichart-eula | |
| 5.2.69 | https://www.scichart.com/scichart-eula | |
| 5.2.62 | https://www.scichart.com/scichart-eula | |
| 5.2.55 | https://www.scichart.com/scichart-eula | |
| 5.2.45 | https://www.scichart.com/scichart-eula | |
| 5.2.42 | https://www.scichart.com/scichart-eula | |
| 5.2.41 | https://www.scichart.com/scichart-eula | |
| 5.2.35 | https://www.scichart.com/scichart-eula | |
| 5.2.32 | https://www.scichart.com/scichart-eula | |
| 5.2.28 | https://www.scichart.com/scichart-eula | |
| 5.2.11 | https://www.scichart.com/scichart-eula | |
| 5.1.4 | https://www.scichart.com/scichart-eula | |
| 5.1.0 | https://www.scichart.com/scichart-eula | |
| 5.0.211 | https://www.scichart.com/scichart-eula | |
| 5.0.178 | https://www.scichart.com/scichart-eula | |
| 5.0.170 | https://www.scichart.com/scichart-eula | |
| 4.0.944 | https://www.scichart.com/scichart-eula | |
| 4.0.938 | https://www.scichart.com/scichart-eula | |
| 4.0.933 | https://www.scichart.com/scichart-eula | |
| 4.0.923 | https://www.scichart.com/scichart-eula | |
| 4.0.920 | https://www.scichart.com/scichart-eula | |
| 4.0.918 | https://www.scichart.com/scichart-eula | |
| 4.0.897 | https://www.scichart.com/scichart-eula | |
| 4.0.890 | https://www.scichart.com/scichart-eula | |
| 4.0.873 | https://www.scichart.com/scichart-eula | |
| 4.0.868 | https://www.scichart.com/scichart-eula |
Showing the latest 30 of 235. See every release on npm
Pre-releases (63)
| Version | Released | License |
|---|---|---|
| 6.0.0-alpha.197 | https://www.scichart.com/scichart-eula | |
| 6.0.0-alpha.196 | https://www.scichart.com/scichart-eula | |
| 6.0.0-alpha.195 | https://www.scichart.com/scichart-eula | |
| 6.0.0-alpha.194 | https://www.scichart.com/scichart-eula | |
| 6.0.0-alpha.193 | https://www.scichart.com/scichart-eula | |
| 6.0.0-alpha.192 | https://www.scichart.com/scichart-eula | |
| 6.0.0-alpha.190 | https://www.scichart.com/scichart-eula | |
| 6.0.0-alpha.186 | https://www.scichart.com/scichart-eula | |
| 6.0.0-alpha.182 | https://www.scichart.com/scichart-eula | |
| 6.0.0-alpha.169 | https://www.scichart.com/scichart-eula | |
| 6.0.0-alpha.164 | https://www.scichart.com/scichart-eula | |
| 6.0.0-alpha.162 | https://www.scichart.com/scichart-eula | |
| 6.0.0-alpha.158 | https://www.scichart.com/scichart-eula | |
| 6.0.0-alpha.157 | https://www.scichart.com/scichart-eula | |
| 6.0.0-alpha.152 | https://www.scichart.com/scichart-eula | |
| 6.0.0-alpha.151 | https://www.scichart.com/scichart-eula | |
| 6.0.0-alpha.150 | https://www.scichart.com/scichart-eula | |
| 6.0.0-alpha.149 | https://www.scichart.com/scichart-eula | |
| 6.0.0-alpha.148 | https://www.scichart.com/scichart-eula | |
| 6.0.0-alpha.145 | https://www.scichart.com/scichart-eula | |
| 6.0.0-alpha.133 | https://www.scichart.com/scichart-eula | |
| 6.0.0-alpha.131 | https://www.scichart.com/scichart-eula | |
| 6.0.0-alpha.129 | https://www.scichart.com/scichart-eula | |
| 6.0.0-alpha.124 | https://www.scichart.com/scichart-eula | |
| 6.0.0-alpha.122 | https://www.scichart.com/scichart-eula | |
| 6.0.0-alpha.120 | https://www.scichart.com/scichart-eula | |
| 6.0.0-alpha.118 | https://www.scichart.com/scichart-eula | |
| 6.0.0-alpha.117 | https://www.scichart.com/scichart-eula | |
| 5.2.0-beta.6 | https://www.scichart.com/scichart-eula | |
| 5.2.0-beta.1 | https://www.scichart.com/scichart-eula |
Showing the latest 30 of 63. See every release on npm