nuxt-charts
| Install | |
|---|---|
npm install nuxt-charts@next |
|
| Latest Version: | 3.1.0 |
| Vue: | 3 |
| License: | MIT |
| Last Updated: | Oct 13, 2026 |
| Links: | GitHub · npm |
Vue-chrts
This is a monorepo for vue-chrts, the legacy Nuxt module, and the next nuxt-charts module.
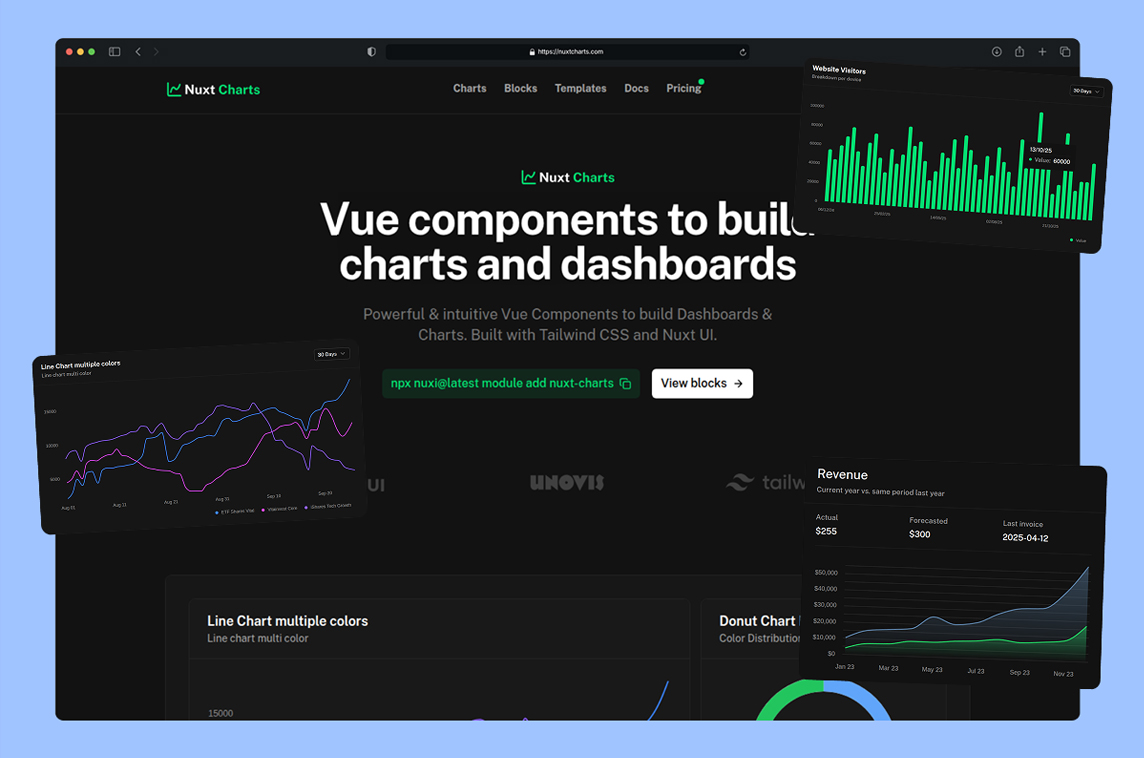
A Vue 3 charts package inspired by Tremor, built on top of Unovis. Vue-Chrts provides beautiful, responsive charts for your Vue applications with minimal setup.
Features
- 📊 Multiple chart types: Line, Bar, Area, Stacked Area, Donut
- 🎨 Customizable
- 📱 Responsive design
- 💡 Simple, intuitive API
- 🚀 Built with Vue 3 and TypeScript
Installation Nuxt
# npm
npm install nuxt-charts

# yarn
yarn add nuxt-charts

# pnpm
pnpm add nuxt-charts

# Add module to your nuxt.config.ts
export default defineNuxtConfig({
  modules: ["nuxt-charts"]
});
Installation Vue.js
# npm
npm install vue-chrts

# yarn
yarn add vue-chrts

# pnpm
pnpm add vue-chrts

# import component
import { LineChart } from 'vue-chrts';
Usage Example
<script setup>
import { LineChart } from 'vue-chrts';

const data = [
  { month: 'Jan', sales: 100, profit: 50 },
  { month: 'Feb', sales: 120, profit: 55 },
  { month: 'Mar', sales: 180, profit: 80 },
  { month: 'Apr', sales: 110, profit: 40 },
  { month: 'May', sales: 90, profit: 30 },
];

const categories = {
  sales: {
    name: 'Sales',
    color: '#3b82f6'
  },
  profit: {
    name: 'Profit',
    color: '#10b981'
  }
};

const xFormatter = (i) => data[i].month;
</script>

<template>
  <LineChart
    :data="data"
    :categories="categories"
    :height="300"
    :xFormatter="xFormatter"
    xLabel="Month"
    yLabel="Amount"
  />
</template>
Available Charts
LineChartBarChartAreaChartAreaStackedChartDonutChart
Vue charts
Make better dashboards with with Vue charts This library simplifies the process of integrating beautiful Vue charts into any modern web application or dashboard.
Credits
This library is inspired by Tremor and built on top of Unovis.
Angular
Looking for the Angular charts variant? Check the Angular Charts website or the GitHub repo here.
License
MIT
Related Packages
Vue 3 chart components built on Unovis — Area, Bar, Line, Donut, Sparkline and T...
Nuxt module for @memotux/vue-plot — declarative data visualization with Observab...
Version History
| Version | Released | License |
|---|---|---|
| 3.1.0 | MIT | |
| 3.0.0 | MIT | |
| 2.2.3 | MIT | |
| 2.2.2 | MIT | |
| 2.2.1 | MIT | |
| 2.2.0 | MIT | |
| 2.1.4 | MIT | |
| 2.1.3 | MIT | |
| 2.1.2 | MIT | |
| 2.1.1 | MIT | |
| 2.1.0 | MIT | |
| 2.0.0 | MIT | |
| 1.0.2 | MIT | |
| 1.0.1 | MIT | |
| 1.0.0 | MIT | |
| 0.2.4 | MIT | |
| 0.2.3 | MIT | |
| 0.2.2 | MIT | |
| 0.2.1 | MIT | |
| 0.2.0 | MIT | |
| 0.1.11 | MIT | |
| 0.1.10 | MIT | |
| 0.1.9 | MIT | |
| 0.1.8 | MIT | |
| 0.1.7 | MIT | |
| 0.1.6 | MIT | |
| 0.1.5 | MIT | |
| 0.1.4 | MIT | |
| 0.1.3 | MIT | |
| 0.1.2 | MIT |
Showing the latest 30 of 31. See every release on npm
Pre-releases (106)
| Version | Released | License |
|---|---|---|
| 3.0.0-beta.4 | MIT | |
| 3.0.0-beta.3 | MIT | |
| 3.0.0-beta.2 | MIT | |
| 3.0.0-beta.1 | MIT | |
| 3.0.0-beta.0 | MIT | |
| 2.2.1-beta.0 | MIT | |
| 2.1.5-test.0 | MIT | |
| 2.1.4-beta.0 | MIT | |
| 2.1.3-test.7 | MIT | |
| 2.1.3-test.6 | MIT | |
| 2.1.3-test.5 | MIT | |
| 2.1.3-test.3 | MIT | |
| 2.1.3-test.2 | MIT | |
| 2.1.3-test.1 | MIT | |
| 2.1.3-test.0 | MIT | |
| 2.1.2-test.1 | MIT | |
| 2.1.2-test.0 | MIT | |
| 2.1.1-test.5 | MIT | |
| 2.1.1-test.4 | MIT | |
| 2.1.1-test.3 | MIT | |
| 2.1.1-test.2 | MIT | |
| 2.1.1-test.1 | MIT | |
| 2.1.0-beta-9 | MIT | |
| 2.1.0-beta-8 | MIT | |
| 2.1.0-beta-7 | MIT | |
| 2.1.0-beta-6 | MIT | |
| 2.1.0-beta-5 | MIT | |
| 2.1.0-beta-4 | MIT | |
| 2.1.0-beta-3 | MIT | |
| 2.1.0-beta.3 | MIT |
Showing the latest 30 of 106. See every release on npm